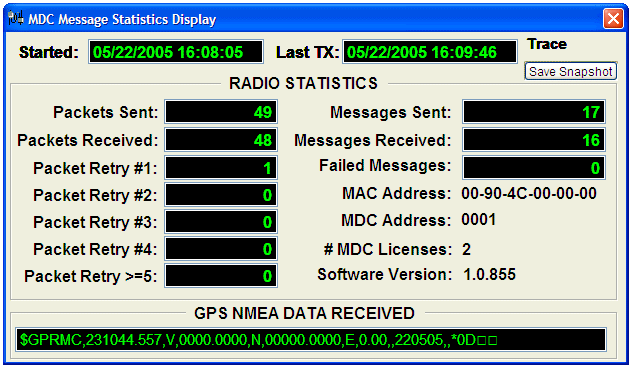
In an effort to assist the process of optimizing your data communications environment, the MDC software can expose or show you certain diagnostics statistics related to MDC packets and messages. To activate the MDC Message Statistics Display popup window select Radio Statistics from the View Menu. During normal operation this diagnostics display window should remain closed.

You can take a snapshot of the MDC Message Statistics at any given moment by clicking the “Save Snapshot” button on the MDC Message Statistics Display. This will automatically write the current MDC statistics and workstation information to a text file named: “MDC_Diagnostic_YYYYMMDDHHMMSS.txt (Where YYYYMMDDHHMMSS represents the Year (YYYY), Month (MM), Day (DD), Hour (HH), Minutes (MM), Seconds (SS) ).
* The Packet Retry Counters track packets that were not ACK’d and subsequently re-sent. Retries and Failures are never tabulated for Broadcast and non-acknowledged messages and no deliver confirmation is required. In older version of the MDC software packet retry counters were level cumulative however this is no longer the case. If, for example, it requires 2 retries to deliver a message only the Packet Retry #2 counter is tabulated.
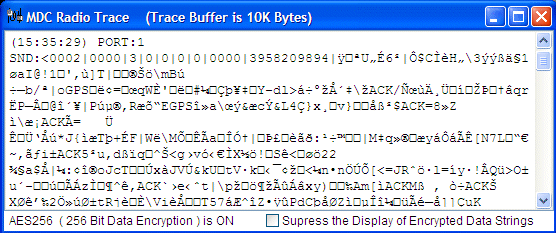
In addition to the statistics display panel a radio TRACE window can be activated to monitor MDC data transmit and receive activity. Data is displayed as packetized blocks in sequence to how it is transmitted. When message encryption is turned off all text is human readable although it is broken into chunks (defined by the MAXPACKETSIZE= setting) and presented in descending order with the most recent data packets and acknowledgment transmissions shown first. When message encryption is turned ON only the packet header information is human readable.

MDC data is usually compressed and encrypted (see: Message Security) thus only the record header will be human readable in the trace windows.